The Athlete’s Guide to Calories Burned – What the Number Really Means
The Athlete’s Guide to Calories Burned
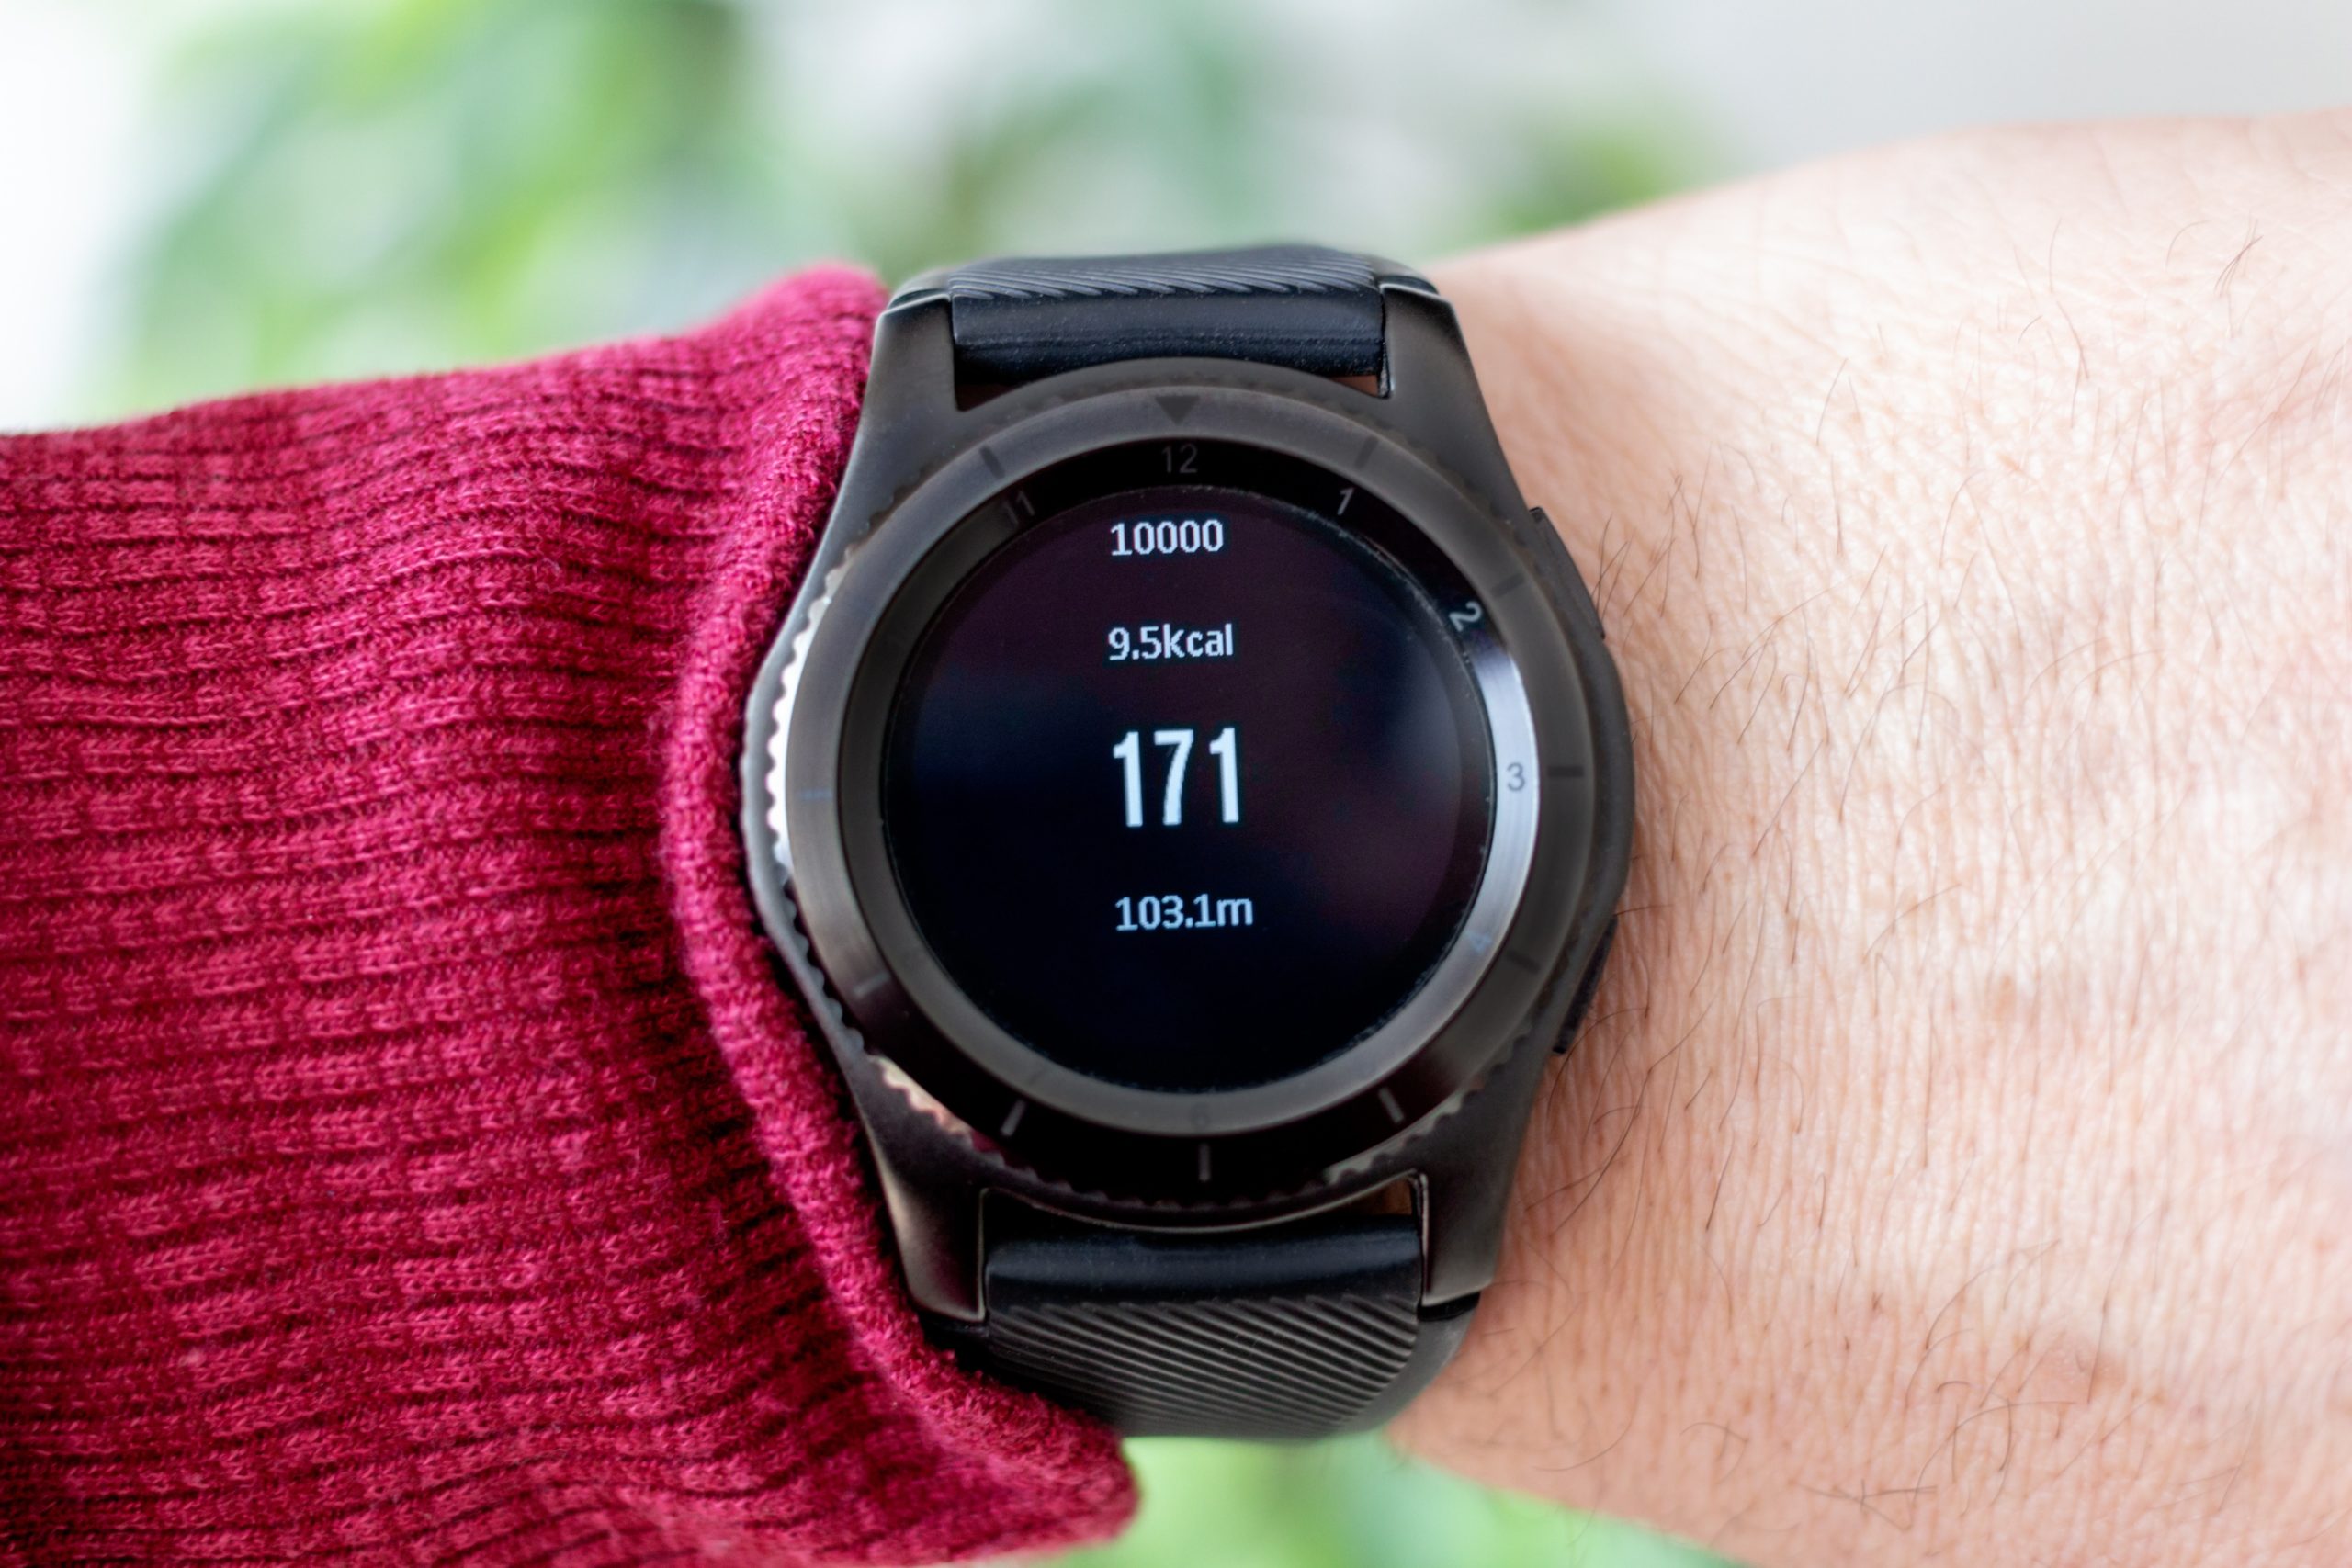
I’ve yet to meet an athlete who isn’t intrigued by the metrics reported on their sports device. Thanks to wearable watches and technological advances, we are attuned to data such as resting heart rate, pace, wattage, sleep metrics, calories burned, etc. Much of this data is beneficial for training and recovery purposes. However, calories burned during an activity can create confusion. So, before we jump into deciphering caloric output during training and how to use it, let’s take a step back and assess the components that affect metabolism.
Resting Metabolic Rate (RMR)
RMR is the amount of energy required to keep your body functioning while at rest – such as if you didn’t get out of bed for a day. RMR makes up approximately 60-75% of total daily energy expenditure (TDEE). But this percentage can vary widely, especially among long-distance and competitive athletes who burn a significant number of calories when training. RMR can be estimated by validated formulas online based on height, weight, age, and lean body mass percentage. However, many professional trainers and health care specialists use a calorimetry machine to measure RMR by measuring respiratory gases for a more accurate prediction. Typically, RMR is measured first thing in the morning after a 12 hour fast.
Some key takeaways include RMR decreases with age, is higher in individuals with more body mass, increases in those with greater muscle mass, and decreases with greater body fat stores.
Non-Exercise Activity Thermogenesis (NEAT)
The energy required to carry out daily activities such as doing laundry, taking the stairs, running errands, cooking, etc. Daily movement accounts for approximately 10-15% of daily energy expenditure and is directly affected by the activity level of your day-to-day responsibilities, job, and lifestyle.
To factor in daily activity levels (not considered exercise), multiply RMR by 1.25 for a sedentary job, 1.50 for a primarily sedentary job with consistent movement in the day, and 1.75 for an athlete who exercises one hour/day or has an active vocation equivalent to 6-8 miles/day.
Thermic effort of food (TEF)
Believe it or not, you burn calories digesting and absorbing food. Although what you eat affects the TEF, this process only accounts for approximately 10% of daily energy expenditure. Meals that include a mix of macronutrients account for 10% of energy ingested; however, when only one macronutrient is consumed, TEF varies considerably. For example, fat has the lowest thermic effect at only 3% of ingested fat calories, carbohydrates at 5-10%, and protein has the highest thermic effect at 20-30% of protein calories consumed.
Exercise energy expenditure
The calories required to support training and exercise. Caloric output varies based on daily training duration and intensity. For example, a 6-hour bike ride followed by a 45-minute brick would burn several thousand more calories than a single 4-mile run. However, if we compared two 45-minute bike rides, one being an easy aerobic ride and the other consisting of above threshold intervals, the interval ride would burn more calories.
*See the chart below for activity energy expenditure.
Why energy expenditure is important for performance goals and health.
As an athlete, it’s wise to understand the impact daily training has on your Daily Energy Expenditure (TDEE). The number of calories burned during training on heavy training days could more than double RMR + NEAT combined. Applying this information to a well-thought-out sports fueling plan ensures you are getting enough calories in workouts to support recovery and fitness gains. Adequately fueling is critical to health and athletic success. Unfortunately, it’s not uncommon among athletes, especially women, to be in a state of Low Energy Availability (LEA) and RED-S (relative energy deficiency), which come with a host of health and performance consequences. LEA and RED-S occur when caloric intake is insufficient to meet daily energy and training demands.
Symptoms of low energy availability:
- Confusing “overtrained” when you aren’t eating enough.
- LEA increases irritability, anxiety, and depression.
- Performance plateaus or a decrease despite training consistently. More difficult to hit your wattage, decreased power and strength, heart rate is either too low or high for the effort, and inability to recover.
- If female, your menstrual cycle shortens and becomes lighter, or you skip a period or two.
- More susceptible to stress reactions and fractures.
- Gut microbiome is off due to chronic inflammation from the stress of not having enough energy to perform daily and training functions. IBS, bloating, gas, nausea, and feeling poorly after a meal are symptoms of an imbalance in the gut microbiome.
The post-season is ideal for focusing on body composition goals since performance is no longer the training focus. When training stress is low, there is little to no need for sports fueling and recovery, so an athlete can focus on adapting daily nutrition to support a healthy weight loss or weight gain plan, depending on the goals. When trying to improve body composition, do not reduce calorie intake below RMR or you risk burning lean body mass for energy, which results in a lower RMR.
Calculating training expenditure is commonly taken from our training device’s calories burned workout report. However, athletes fall into a common pitfall by overestimating caloric needs and then wondering why they are gaining unwanted weight while training for an endurance race. When a completed workout reports X calories burned, we assume that X calories all came from carbohydrates, which need to be replaced. But in this case, the math doesn’t add up. During all activities, from sleeping to running all out, your body is fueled by a combination of carbohydrates and fat and a small amount of protein depending on the duration of activity and food intake. You burn a higher percentage of fat when heart rate is low (like when you’re recovering on the couch, sleeping, walking, or light jogging), and a higher percentage of carbohydrates when heart rate is high (during speed work, tempo runs, and hill repeats).
But there is always a combination of fuel sources at any given output.
For example, during a 60 minute run, let’s say your watch reports 700 calories burned. Knowing this, you might think there is some cushion in your daily caloric allotment. However, the information doesn’t consider the fuel source of the 700 calories – which depends on the intensity and terrain of the workout. During an easy one-hour run of 700 calories burned, you might burn a 50/50 ratio as 350 calories from fat and 350 from carbohydrates. The fat calories don’t need to be replaced if the goal is to shed fat, but the carbohydrate calories do. 350 calories will naturally occur at your next timely meal. As you can see, using calories burned from exercise in your daily energy expenditure can’t be taken at face value when applying it to body composition goals.
Calculating RMR
There is no single best equation for all athletes because of body composition diversity. Therefore, athletes are encouraged to use multiple equations to offset a falsely high or low RMR value from using only one formula.
RMR can be estimated at 11-12 calories per pound (24-26 kcal/kg) of body weight but can be lower or higher.
The Cunningham equation uses fat-free mass (FFM) and is ideal for athletes who have an accurate FFM calculation.
RMR = 370 + (21.6 x lean body mass in [kg])
The Mifflin-St. Jeor equation is most accurate for the general population.
Men: RMR = (9.99 x wt [kg]) + (6.25 x ht [cm]) – 4.92 x age) + 5
Women: RMR = 9.99 x wt [kg]) + (6.25 x ht [cm] – 4.92 x age) – 161
Harris-Benedict Equation – most widely used equation for calculating RMR and total calories, includes age, weight, height but not FFM.
Men: RMR = 66.47 + (13.75 x wt [ kg]) + (5.003 x ht [cm] ) – ( 6.755 x age in years )
Women: RMR = 655.1 + (9.563 x wt [kg] ) + ( 1.850 x ht [cm] ) – ( 4.676 x age in years )
kg = pounds divided by 2.2 Ex) 160lb = 73kg
cm = height in inches x 2.54 Ex) 68 inches = 173cm
Estimating Energy Needs and Activity Level
A simple method for estimating daily calorie needs categorizes training sessions by intensity, duration, and body weight.
- Mild activity – no structured training, a rest day from training. 12-14 calories per pound (26-31kcal/kg) of body weight.
- Up to 1 hour of moderate exercise. 15-17 calories per pound (33-37kcal/kg) of body weight.
- High-activity – 1 -2 hours of moderate-intensity exercise. 18-24 calories per pound (40-53kcal/kg) of body weight.
- Very high level of activity – 3+ hours of training. 24-29 calories per pound (53-63kcal/kg) of body weight.
*These calculations take RMR, daily energy needs, and training energy into account.
Using this calculation, a 150lb (68kg) athlete who cycled for 2 hours would require 2700-3600 calories for that day.
Putting It All Together
Case Study: Sally weighs 130 lbs, has 21% body fat, and races Ironman distance triathlon. She has completed her final race of the season. Her post-season focus is to improve body composition while maintaining lean body mass.
Fat pounds are 130 x .21 = 27.3
Lean mass or fat-free mass is 130 – 27.3 = 102.7 lb.
102.7 lb. lean mass = 47kg
We will use the Cunningham equation to calculate RMR since we have an accurate FFM:
RMR = 370 + (21.6 x 47) = 1385 calories
TEF = 200 calories
RMR (1385) + TEF (200) = 1585 calories
Adding in daily activity. Sally has a desk job, so multiply her RMR by 1.25
1585 x 1.25 = 1981 calories
Today her training includes an 80 min (9 min/mile pace) low-intensity run. Using the table provided below:
The total energy cost of the run: (cal x min x lbs).
0.09 x 80 x 130lbs = 936 calories burned. (approx. 450 were from fat since it was a low-intensity run, and Sally reports the rate of perceived exertion 5-6/10 effort). Heart rate remained in Zone 1-2.
Given Sally’s goal to shed body fat, we subtract 40% (calories from fat) of total calories burned during the run.
Total run calories (936) – calories from fat (374) = 562 calories from carb
Total daily energy requirements for this day: 1981 + 562 = 2543 calories
Additional recommendations to help Sally achieve her post season goals are:
- 2-3 sessions of strength training per week,
- Consume 20g protein with some carbohydrates following training sessions,
- Aim for 100g protein per day divided evenly among meals and snacks
- Aim for 8 hours of sleep/night,
- Increase veggie and fruit intake
- Drink water with meals, snacks, and during training.
- Include sprint interval training to fire up fast-twitch muscle fibers, increase aerobic capacity, improve insulin sensitivity, metabolic efficiency, increase lean muscle mass, and boost power and cardiovascular fitness.
Final Word on Caloric Output and Energy Balance
Energy balance is a dynamic equation and shouldn’t be confused with a simple calculation. For example, weight loss can increase hunger and decrease energy expenditure which may trigger a reoccurrence of weight gain. Also, as exercise expenditure goes up, NEAT typically goes down. Therefore, maintaining a consistent training regimen, eating balanced meals and snacks, understanding the substrates utilized in training based on effort, and avoiding the fad, gimmickry diet traps is key to developing the most effective individualized approach to healthy body weight and composition.
The Athlete’s Guide to Calories Burned


